(How to Check Kibana Version in Linux)Kibana is a powerful visualization tool used alongside Elasticsearch for monitoring and data analysis. Knowing which version of Kibana is running is essential for troubleshooting, updating, and ensuring compatibility. This guide will walk you through different methods to check your Kibana version on a LinuStep 1: Check the Kibana Version using the command prompt
Step 1: Check the Kibana Version using the command prompt
What we need to be concerned about is the Kibana version. The easiest way to find the Kibana version is through the command line.
Here’s how to do it:
Open Terminal: Access the terminal of your Linux system; this will be their stage. The terminal can be opened from the applications menu, from the system option, by typing terminal or using a hotkey, which is Ctrl + Alt + T.
Navigate to Kibana Directory: If you are aware of Kibana’s installation directory, then use the CD command to go to that path. For example:

If you are not sure where the path is, then you can easily determine that the default installation directory for most distributions of Kibana for Linux is /usr/share/kibana.
Run the Version Command: To check the version, execute the following command:

This should return the version number of your Kibana installation, such as:

Step 2: What is the version of Kibana that is running?
It is from the system service. If Kibana is managed by systemd, you can also find the version by looking at the service status:
Check Kibana Service Status: Run the following command:

This may reflect the Kibana version in the description or in the log, if there is such configuration. Here you need to look for lines where version number is mentioned.
Step 3: Verify the Kibana Version with the REST API
If Kibana is currently running and open in a web browser, one can check Kibana’s version using the REST API utility. Follow these steps:
Open Terminal: Open up the terminal, and from the terminal, enter the curl command to request the Kibana instance.
Send a Request to the Kibana Instance: Use the following curl command to get the version details.

If you are using any authentication, then replace <username> and <password> with your real username and password.
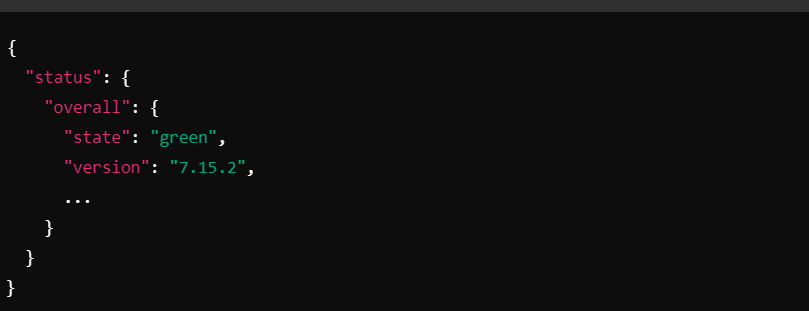
Check the Output: Scrolling through the JSON output, you have to find out the version field. It should look something like this:

This confirms the running version of Kibana we are using to use to analyze an event.
Step 4: Select the Version in the Kibana on the UI
If you have access to the Kibana web interface, you can quickly check the version from the GUI:
Open Kibana in a Browser: Open your web browser and enter the URL of Kibana. The default URL is usually:

Log In:
If authentication is active, type in the login name and password.
Go to the “About” Section: In the Kibana interface, go to the lower left-hand corner and click the menu button. Select the Management or Help tab. You will locate it there, where the version of the Kibana will be displayed.
Step 5: Check the Kibana Version (from the Installation Directory)
If none of the above methods work, you can determine the version by opening the package.json file of the Kibana installation directory.
Navigate to the Kibana Installation Directory: Open the terminal and go to the Kibana home directory:

Check the package.json File:
Open the package.json file to view its contents using a text editor like nano or Cat:

You’ll find a line similar to:

This indicates the Kibana version.
Conclusion
It is very simple to check the Kibana version by command prompt, by accessing the Kibana dashboard directly or by making an HTTP request. That was quite a detailed list of settings and needs; just choose the method that you best fit. Knowing the exact version is very important for updates, for determining compatibility, and when troubleshooting problems in your Elastic Stack setting.
If you have stuck somewhere during the process, then let me remind you that this guide will help you easily verify your Kibana version on a Linux system.


